Editorial scope: This checklist explains a repeatable diagnostic process. It does not promise a perfect Lighthouse score, higher rankings, or a particular conversion result. Performance varies by page template, device, network, audience and release.
What Core Web Vitals measure
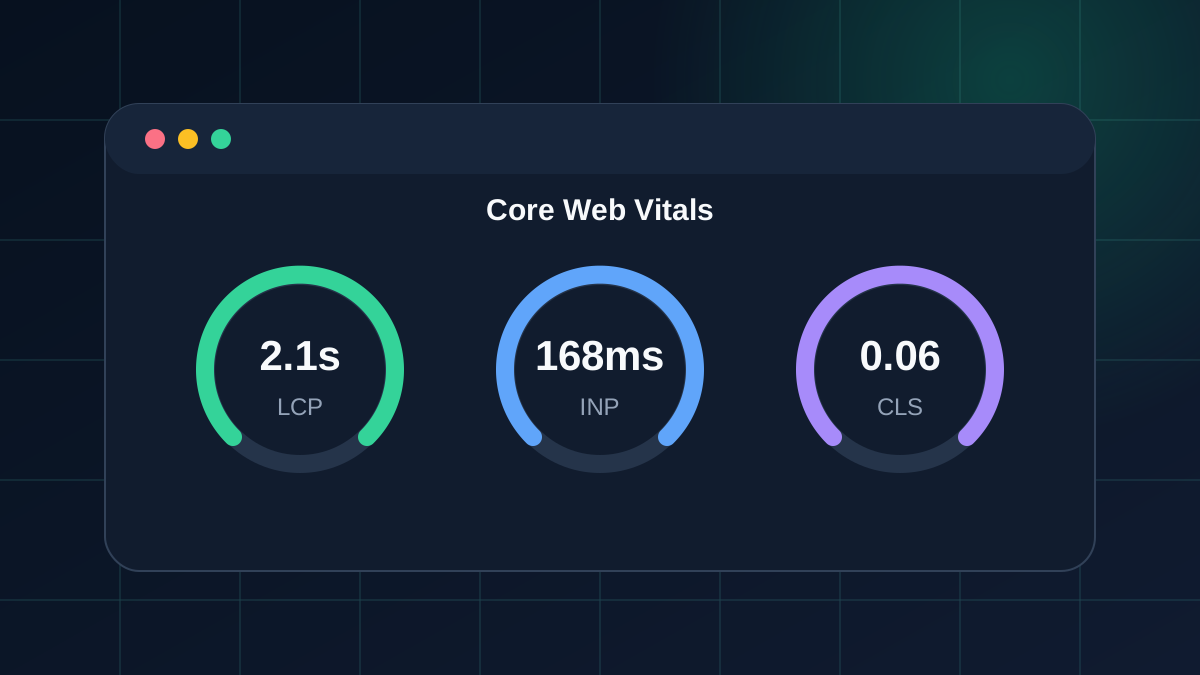
Google's current Core Web Vitals are Largest Contentful Paint (LCP), Interaction to Next Paint (INP) and Cumulative Layout Shift (CLS). LCP represents loading performance, INP represents responsiveness across user interactions, and CLS represents visual stability. Google's documented “good” targets are LCP within 2.5 seconds, INP below 200 milliseconds and CLS below 0.1, assessed at the 75th percentile of page loads.
These metrics are useful signals, not a shortcut to search visibility. Google recommends good Core Web Vitals for users and Search, while explicitly noting that strong results do not guarantee top rankings. Treat the thresholds as an experience baseline and investigate the actual user journey behind each number.
Step 1: Separate field data from lab data
Start with the right evidence. Field data describes visits from real Chrome users when enough data is available. Lab data is collected in a controlled test and is valuable for debugging before and after a change. PageSpeed Insights can show both, but the two sections answer different questions.
- Use field data for impact: Check the Chrome User Experience Report data in PageSpeed Insights or Search Console to understand what eligible real users experienced over time.
- Use lab data for diagnosis: Reproduce a slow template with Chrome DevTools or Lighthouse and inspect the loading timeline, network requests and main-thread work.
- Do not substitute one for the other: Lighthouse cannot measure a full distribution of real interactions. In the lab, Total Blocking Time can help expose main-thread problems, but it is not the same metric as field INP.
Record the URL, template, device profile, test location, date and tool version. A score without this context is difficult to reproduce and easy to misinterpret.
Step 2: Diagnose LCP by finding the actual element
The LCP element is often a hero image, poster image, heading or large text block. Identify it in the performance trace before changing code. Then divide the delay into delivery and rendering work.
- Confirm that the main resource starts early. A hero image hidden behind client-side rendering, a late CSS background declaration or a JavaScript carousel can delay discovery.
- Resize and compress the asset for its display size. Use a modern format where it works for the project, but verify visual quality instead of applying one quality setting everywhere.
- Avoid lazy-loading an above-the-fold LCP image. Give important images explicit dimensions, and use responsive image candidates so small screens do not fetch an unnecessarily large file.
- Reduce render-blocking work. Remove unused critical-path code, split optional JavaScript, and keep third-party scripts out of the initial path when the user does not need them immediately.
- Review server response and cache behavior. Rendering strategy can help, but changing to server-side rendering is not automatically the right fix; the bottleneck may be an image, font, API request or edge configuration.
Step 3: Diagnose INP from real interactions
INP evaluates responsiveness over the life of a page, so test more than the first click. Exercise navigation, filters, search, accordions, forms, modal dialogs and any interaction that updates a large part of the interface. A slow interaction can contain input delay, event-handler work and time waiting for the next frame to paint.
- Break long tasks into smaller units so the browser can respond between them.
- Avoid rerendering an entire page for a small state change. Profile the affected component tree and memoize only where measurement supports it.
- Move non-urgent work out of the interaction path. Analytics enrichment, large calculations and optional fetches should not block visible feedback.
- Provide immediate state feedback, such as a pressed state or progress indicator, while longer work continues.
Test on representative lower-powered mobile hardware as well as a developer laptop. A trace captured on a fast machine can conceal work that is obvious to users on constrained devices.
Step 4: Prevent CLS by reserving space
Unexpected movement is commonly introduced by images without dimensions, injected banners, embeds, fonts and advertising containers. Reserve the final footprint before the resource arrives. For responsive media, width and height attributes can establish an aspect ratio while CSS controls the rendered size.
Place consent notices and promotional bars in a stable region rather than inserting them above existing content after load. Allocate fixed or minimum space for ad slots at each breakpoint. When fonts change line wrapping, use a suitable fallback and review font loading behavior. Animations should generally use transforms rather than layout-changing properties when motion is appropriate.
Step 5: Validate the change as a release
Retest the same page in the same lab conditions, then deploy through the normal release process. Watch error reporting and real-user performance by template. Field data uses an aggregation window, so it will not confirm a production improvement immediately.
A practical acceptance record includes the original symptom, evidence, suspected cause, code or content change, lab result, release date and follow-up field result. This makes performance work auditable and guards against repeating a regression.
Final checklist
- Identify which template and audience segment is affected.
- Confirm whether the evidence is field data or a lab reproduction.
- Inspect the actual LCP element, slow interaction or shifting element.
- Make the smallest targeted change that addresses the measured cause.
- Check mobile layouts, keyboard interaction and reduced-motion behavior after the change.
- Re-run repeatable lab tests and monitor field data after release.